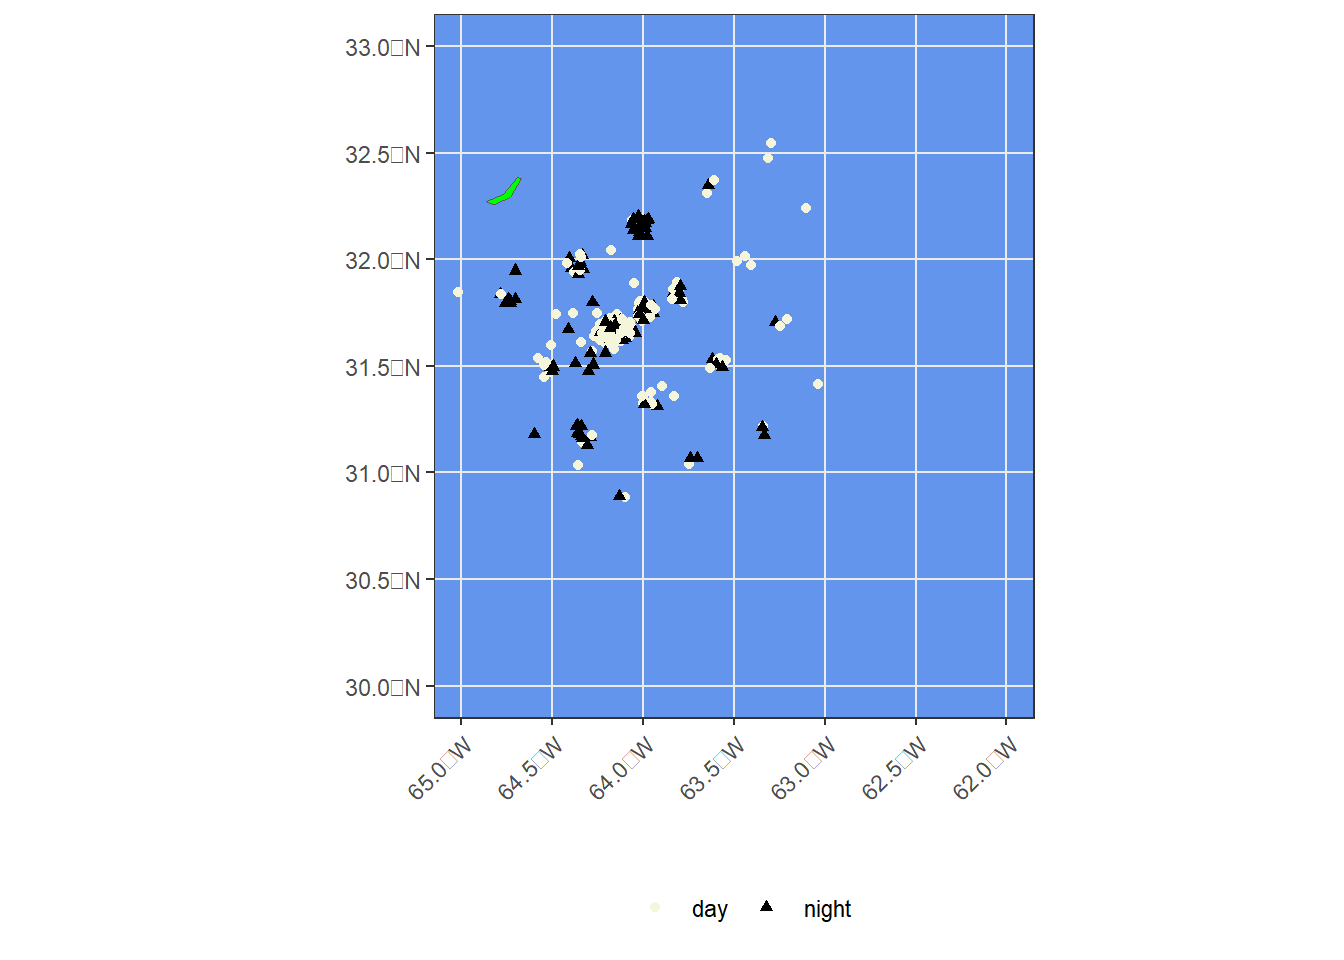
Casts were conducted aboard the R/V Atlantic Explorer. For analysis in this paper, casts on a single cruise are pooled together as if sampling one large water mass in separate locations. Daytime and nighttime casts are pooled in each cruise. Cruises sampled along a grid of locations surrounding the BATS region, southeast of Bermuda.
Code
rm(list =ls())library('ggplot2')library('rnaturalearth')library('rnaturalearthdata')# |- get spatial data ----------world <-ne_countries(scale ='medium', returnclass ='sf')# |- read in data -----------------cast_loc <-readRDS('../data/01_ctd-locations.rds')
Code
all_cast_map <-ggplot()+geom_sf(data = world, fill ='green')+geom_point(aes(x =-cast_loc$lon, y = cast_loc$lat,shape = cast_loc$tod, col = cast_loc$tod),position =position_jitter(width = .05, height =0.05))+coord_sf(xlim =c(-65,-62), ylim =c(30,33))+theme_bw()+labs(x ="",y ="", shape ="", color ="")+scale_color_manual(values =c('beige','black'))+theme(panel.background =element_rect(fill ='cornflowerblue'),axis.text.x =element_text(angle =45, hjust =c(1,1)),legend.position ='bottom')print(all_cast_map)
---title: CTD & UVP cast locations---Casts were conducted aboard the R/V Atlantic Explorer. For analysis in this paper, casts on a single cruise are pooled together as if sampling one large water mass in separate locations. Daytime and nighttime casts are pooled in each cruise. Cruises sampled along a grid of locations surrounding the BATS region, southeast of Bermuda.```{r}rm(list =ls())library('ggplot2')library('rnaturalearth')library('rnaturalearthdata')# |- get spatial data ----------world <-ne_countries(scale ='medium', returnclass ='sf')# |- read in data -----------------cast_loc <-readRDS('../data/01_ctd-locations.rds')``````{r}all_cast_map <-ggplot()+geom_sf(data = world, fill ='green')+geom_point(aes(x =-cast_loc$lon, y = cast_loc$lat,shape = cast_loc$tod, col = cast_loc$tod),position =position_jitter(width = .05, height =0.05))+coord_sf(xlim =c(-65,-62), ylim =c(30,33))+theme_bw()+labs(x ="",y ="", shape ="", color ="")+scale_color_manual(values =c('beige','black'))+theme(panel.background =element_rect(fill ='cornflowerblue'),axis.text.x =element_text(angle =45, hjust =c(1,1)),legend.position ='bottom')print(all_cast_map)``````{r}library(DT)library(dplyr)uvp_data <-readRDS('../data/01_uvp-trim-final_large.rds')# get max_dpar_max_d <-function(par_df) { par_df[['depth']] |>max()}max_d <- uvp_data$par_files |>sapply(par_max_d)uvp_data$meta |>select(profileid, latitude,longitude, cruise, sampledate) |>left_join(data.frame(profileid =names(uvp_data$par_files),max_depth = max_d)) |>group_by(cruise) |>datatable()```