Code
rm(list = ls())
library(cowplot)
library(ggplot2)
<- readRDS('../Output/main_fig_06_profile-biomass-comparison.rds') plot_list
Select Biomass profiles of comparable taxa are shown when measured by the MOCNESS/ZOOSCAN and the UVP. UVP estimates were calculated two ways. In one method, similar UVP casts are pooled then the biomass concentration of organisms in a depth bin were calculated. \[\frac{\sum_{i}^{N}biomass_{i}}{\sum_{i}^{N}volume sampled_{i}}\] The other method, density is calculated in individual uvp casts, then averaged between all similar casts: \[\frac{\sum_{i=1}^{N} \frac{biomass_{i}}{volume sampled_{i}}}{N}\] For all i casts, with a total of N casts.
Biomass was calculuated following Maas et al. 2021 for Annelids, Chaetognaths, Copepods, and Shrimp-like crustaceans.
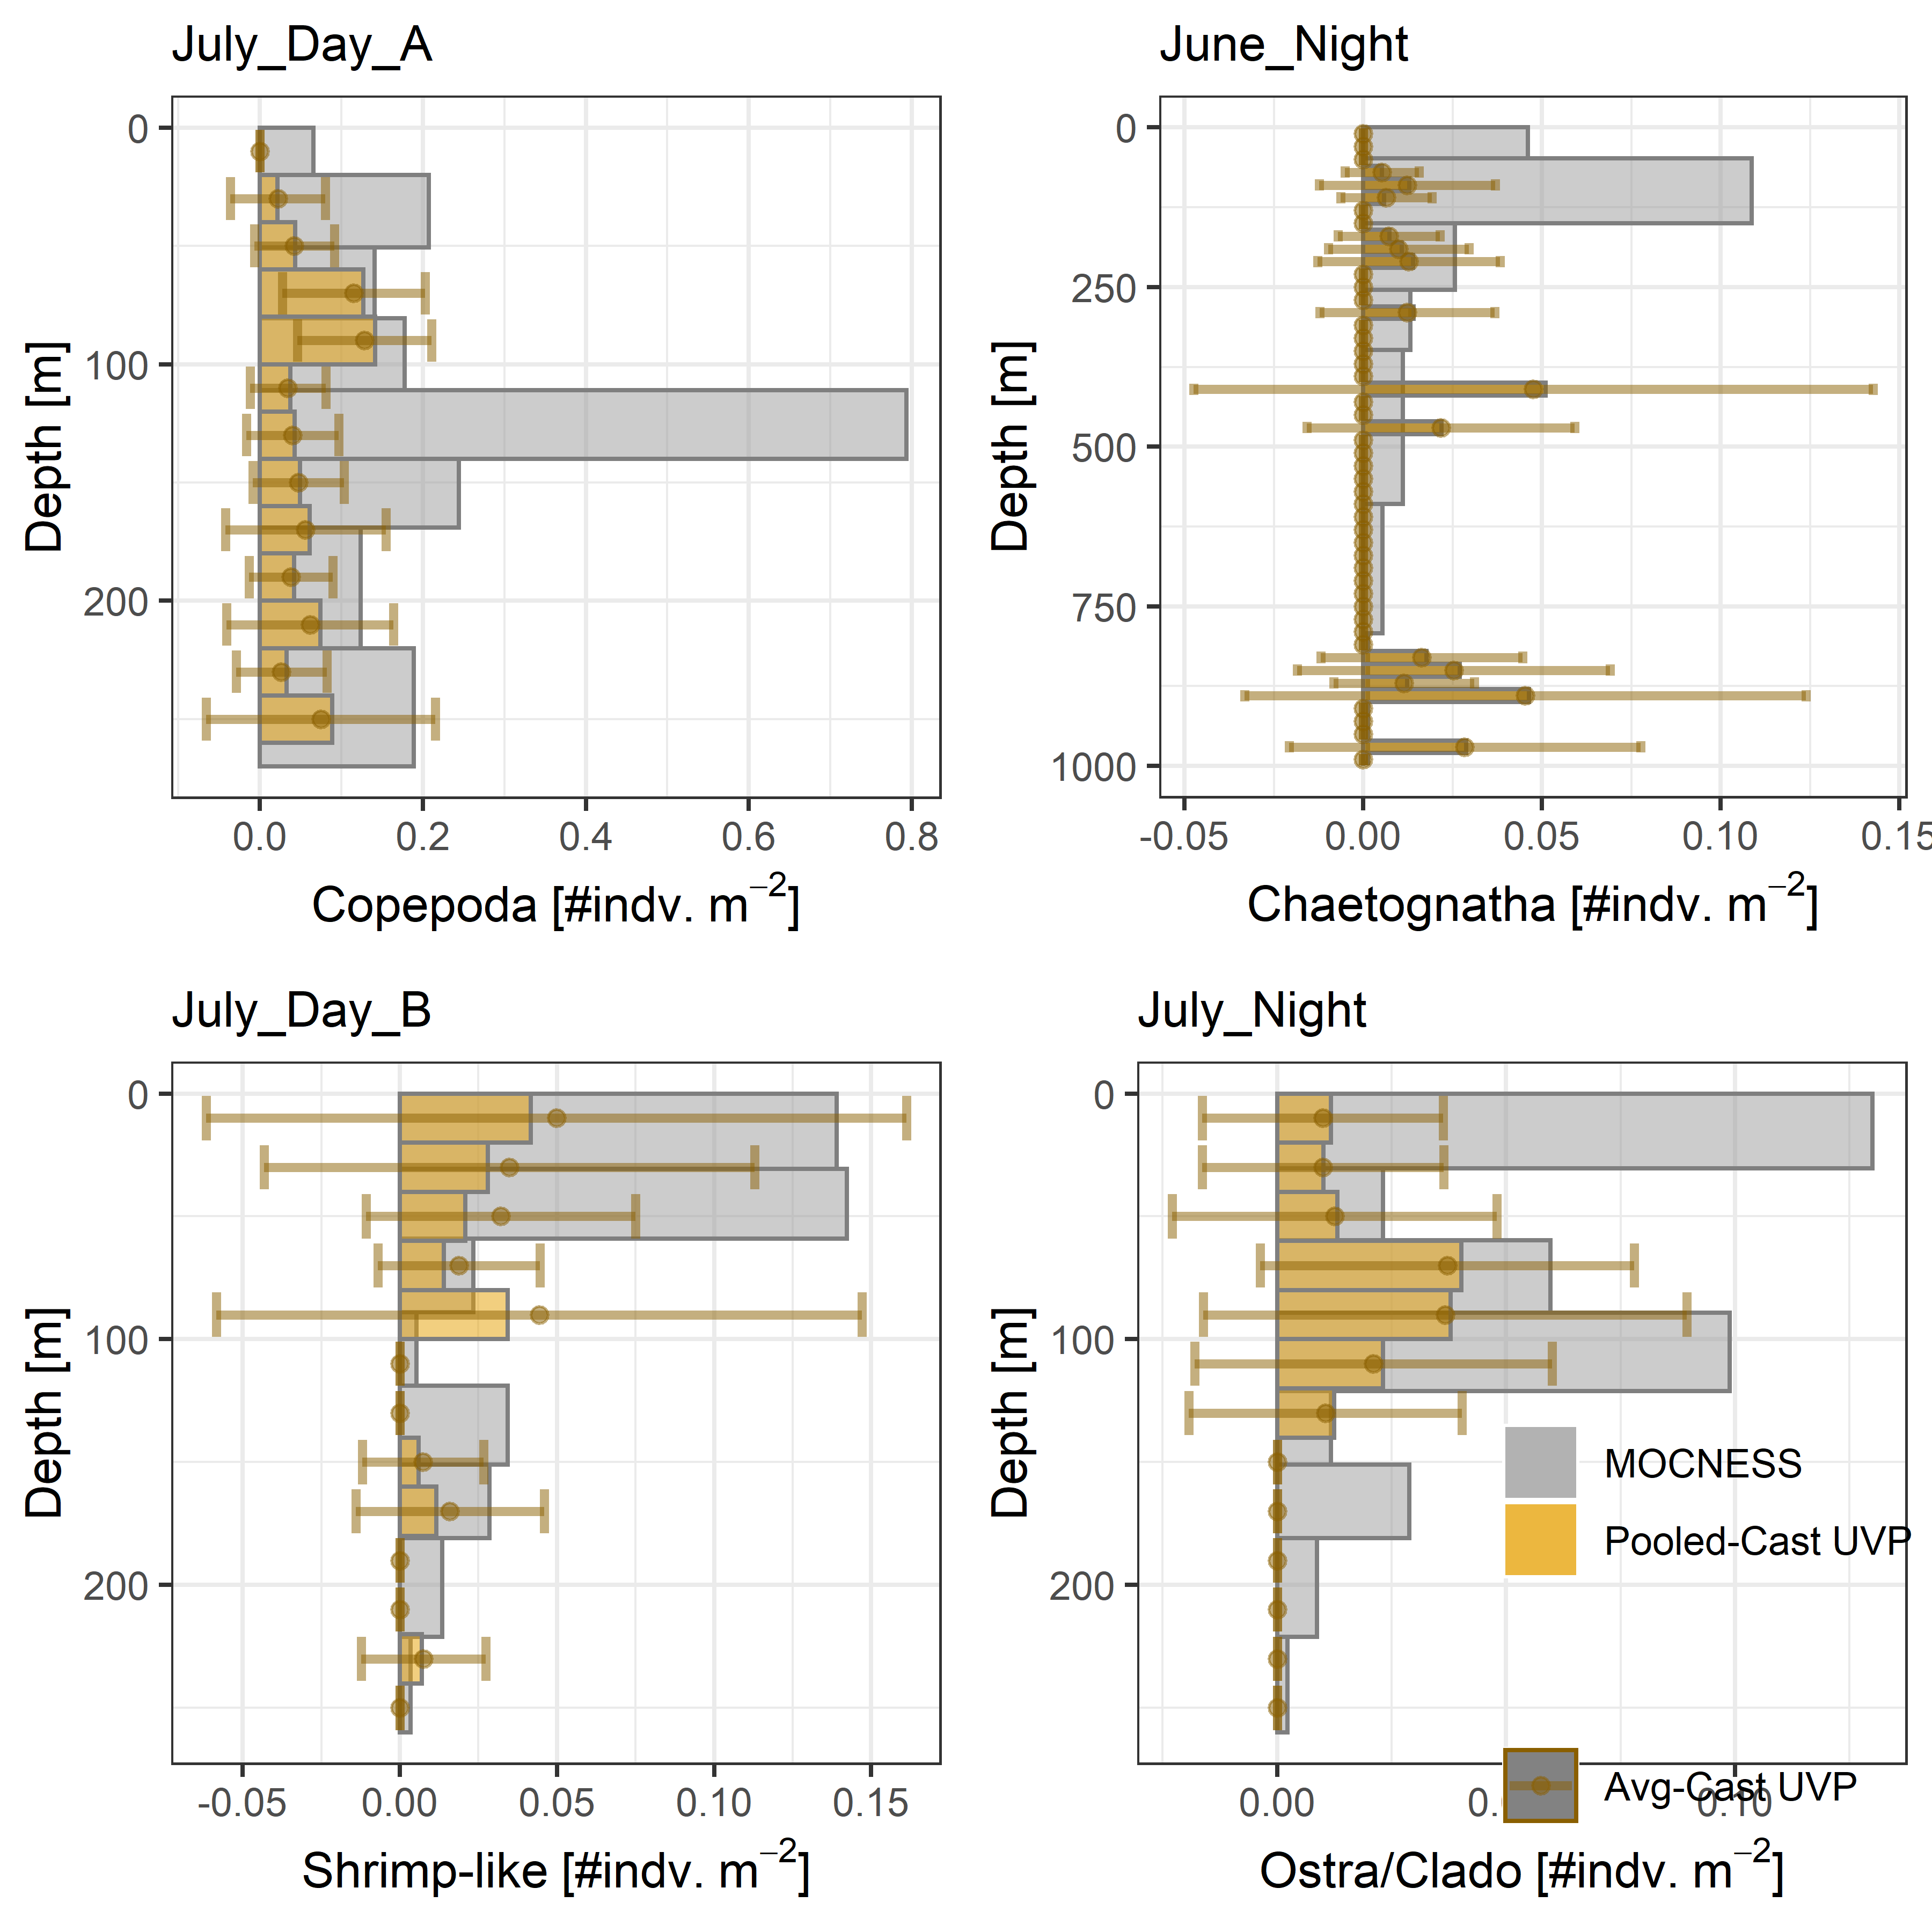
Select Profiles are shown to highlight cases for each taxa. All casts can be seen in Supplemental Figure 7.
---
title: "Select Biomass Profiles"
---
Select Biomass profiles of comparable taxa are shown when measured by the MOCNESS/ZOOSCAN and the UVP.
UVP estimates were calculated two ways. In one method, similar UVP casts are pooled then the biomass concentration of organisms in a depth bin were calculated. $$\frac{\sum_{i}^{N}biomass_{i}}{\sum_{i}^{N}volume sampled_{i}}$$ The other method, density is calculated in individual uvp casts, then averaged between all similar casts: $$\frac{\sum_{i=1}^{N} \frac{biomass_{i}}{volume sampled_{i}}}{N}$$ For all i casts, with a total of N casts.
Biomass was calculuated following [Maas et al. 2021](https://academic.oup.com/plankt/article/43/3/475/6277440) for Annelids, Chaetognaths, Copepods, and Shrimp-like crustaceans.
```{r warning = F, message=F}
rm(list = ls())
library(cowplot)
library(ggplot2)
plot_list <- readRDS('../Output/main_fig_06_profile-biomass-comparison.rds')
```
```{r All-Plots, fig.height=6,fig.width=6,fig.cap='Select taxa depth profiles. Pooled-UVP cast estimates are shown as barplots. Averaged-UVP casts estimates are shown by points with standard deviation shown.',dpi = 300,message=F,warning=F}
#| column: body-outset
grid_theme <- theme(legend.position = 'none')
plot_grid(plot_list$July_Day_A_Copepoda+ grid_theme,
plot_list$June_Night_Chaetognatha+ grid_theme,
plot_list$`July_Day_B_Shrimp-like`+grid_theme,
plot_list$`July_Night_Ostra/Clado`+theme(legend.position = c(.75,.25)),
ncol = 2)
```
-------------------------------------------------------------------------------
Select Profiles are shown to highlight cases for each taxa. All casts can be seen in [Supplemental Figure 7](./supp_analysis_07.html).
------------------------------------------------------------------------------